Profile JVM applicationsλ︎
Profile applications on the JVM, visualising memory and CPU resources, identifying bottlenecks and areas of the code to review to optimise a running application.
Using FlameGraphs To Illuminate The JVM A Simple Approach to the Advanced JVM Profiling
VisualVMλ︎
VisualVM provides a simplified and robust profiling tool for Java applications, bundled with the Java Development Kit (JDK) and using JConsole, jstat, jstack, jinfo, and jmap.
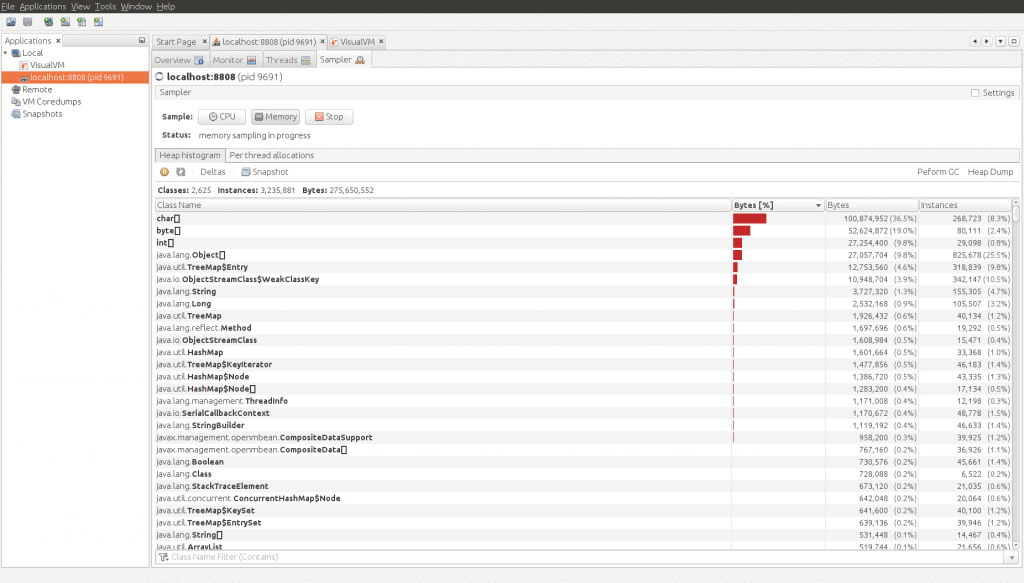
Download the macOS application bundle and double-click to install.
JDK Flight Recorderλ︎
JDK Flight Recorder is a production time profiling and diagnostics engine built into the JVM
- Extremely low overhead - no measurable impact on the running application
- High performance flight recording engine and high performance data collection
- Safe and reliable in production, tested on all platforms as part of the JVM/JDK-testing
- Time machine records data before, up to, and right after a problem occurs (even if the JVM process crashes)
jcmd to access the flight recorder data from the command line
Mission control provides a graphical tool to visualise flight recorder data.
- Continuous Monitoring with JDK Flight Recorder
- JDK11 - Introduction to JDK Flight Recorder
- Production profiling with JDK Flight Recorder & JDK Mission Control
Mission Controlλ︎
Mission Control is an open source desktop tool for visualising production time profiling and diagnostics from the JDK flight recorder tool. JDK Mission Control supports OpenJDK 11 and above.
JDK Mission Control consists of
- A JDK Flight Recorder (JFR) analyser and visualiser
- A Java Management Extensions (JMX) Console
- A heap dump (hprof format) analyzer (JOverflow)
Eclipse Mission Control from Adoptium
Java Mission Control demo - 2014 outated but might be useful if nothing newer
Profiling guidesλ︎
Profiling your Java Application - A Beginner’s Guide - Victor Rentea
Explore three of the best free tools for profiling a Java (Spring) application:
- Using Java Flight Recorder to profile method execution times
- Using Micrometer-Prometheus-Grafana to profile connection starvation issues
- Using Glowroot to identify long-running queries
Referencesλ︎
Java Profilers - Baeldung HotSpot Virtual Machine Garbage Collection Tuning Guide - Oracle